
Sun Drops Energia Share Price
₹ 272
About Sun Drops Energia Share Price
Sun Drops Energia
Sun Drops Energia Limited (formerly Sun Drops Energia Private Limited) is an unlisted renewable energy company currently trading at around ₹295 per share. Incorporated on 28 May 2019 and headquartered in Surat, Gujarat, it is a key subsidiary of KPI Green Energy Limited. The company develops, constructs, owns, operates, and maintains solar and hybrid renewable energy projects while serving both Independent Power Producer (IPP) and Captive Power Producer (CPP) customers.
Unlike traditional EPC companies, Sun Drops follows an integrated business model that combines project development, EPC execution, renewable power generation, and operations & maintenance. This enables the company to generate both project-based income and recurring revenue from long-term power sales.
Over the past few years, Sun Drops has expanded rapidly and has become the KP Group’s dedicated platform for Battery Energy Storage Systems (BESS). With strong financial growth, large BESS project wins, and a proposed FY27 IPO, the company is well positioned to benefit from India’s accelerating renewable energy transition, making it one of the closely watched companies in the unlisted market.
Business Verticals
Sun Drops Energia operates through three integrated renewable energy business verticals that together provide a balanced mix of project execution income and recurring revenue from power generation and energy storage. The company’s business model covers the entire renewable energy value chain, including project development, engineering, procurement, construction (EPC), ownership, operation, and maintenance of renewable energy assets.
a) Captive Power Producer (CPP) & EPC Business
The Captive Power Producer (CPP) business is the company’s primary revenue driver. Sun Drops develops, engineers, procures, constructs, commissions, and maintains grid-connected solar and hybrid renewable energy projects for commercial and industrial customers under the Distributed Renewable Energy Bilateral Purchase (DREBP) framework.
The company undertakes the complete project lifecycle, including land identification, engineering, procurement, construction, grid connectivity, commissioning, and long-term operations & maintenance. Customers own the renewable energy assets, enabling them to reduce electricity costs, achieve sustainability goals, and comply with renewable purchase obligations. Sun Drops primarily focuses on projects of up to 35 MW while also executing turnkey solar EPC and Balance of System (BoS) contracts, providing predictable project-based revenue with relatively lower execution risk.
b) Independent Power Producer (IPP)
Under the Independent Power Producer (IPP) model, Sun Drops owns and operates renewable energy assets by investing its own capital. Electricity generated from these projects is sold through long-term Power Purchase Agreements (PPAs) and open-access arrangements, creating stable and recurring cash flows.
As of FY26, the company operates approximately 22 MW of installed IPP capacity. This business complements the EPC segment by providing predictable long-term revenue and improving earnings visibility through owned renewable energy assets.
c) Battery Energy Storage System (BESS)
Battery Energy Storage Systems (BESS) represent the company’s newest and fastest-growing business vertical. As renewable energy adoption increases across India, battery storage has become essential for improving grid stability, balancing electricity supply and demand, and storing surplus renewable power.
Recognizing this opportunity, KP Group has designated Sun Drops Energia as its dedicated platform for utility-scale BESS projects. During FY26, the company secured two standalone Battery Energy Storage System projects from Gujarat Urja Vikas Nigam Limited (GUVNL):
- 445 MW / 890 MWh Standalone BESS Project
- 120 MW / 240 MWh Standalone BESS Project
These projects provide a combined storage portfolio of 565 MW / 1,130 MWh, positioning Sun Drops Energia among the early participants in India’s utility-scale energy storage market. Management expects the BESS segment to become a significant long-term growth driver as battery storage demand increases alongside renewable energy capacity expansion.
Sundrops Energia Order Book
Sun Drops Energia has built a strong order pipeline, reflecting robust demand for its renewable energy solutions. As of Q3 FY26, the company reported an order book of approximately ₹500 crore, comprising primarily captive solar and hybrid power projects for commercial and industrial customers.
The healthy order book provides strong revenue visibility over the coming quarters and is expected to support the company’s growth as project execution progresses. In addition to its existing EPC orders, the company’s recently secured Battery Energy Storage System (BESS) projects are expected to further strengthen its long-term order pipeline and future revenue potential.
Sun Drops Energia Financial Performance
Sundrops Energia has delivered strong financial growth over the past five years, driven by increasing execution of captive renewable energy projects, expansion of its EPC business, and rising contribution from owned renewable energy assets.
Over the last five years, the company has transformed from a relatively small renewable energy developer into a rapidly growing player in the sector. Revenue increased from ₹4.79 crore in FY22 to ₹586 crore in FY26, representing exceptional growth supported by higher project execution, capacity expansion, and strong demand for captive renewable energy solutions.
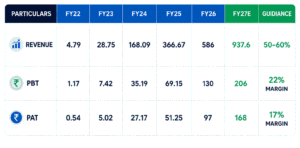
Profitability has also improved significantly, with PBT increasing from ₹1.17 crore to ₹130 crore and PAT rising from ₹0.88 crore to ₹97 crore during the same period. Management expects this growth trajectory to continue and has guided for 50–60% revenue growth in FY27, while maintaining an EBITDA margin of 25–30%. The company’s expansion into Battery Energy Storage Systems (BESS) is also expected to become an important growth driver over the medium term.
Sun Drops Energia Financial Ratios
Sundrops Energia has maintained healthy financial ratios despite its rapid expansion, reflecting efficient capital allocation, improving profitability, and a conservative balance sheet. The company reported a Return on Equity (ROE) of 16.3% and a Return on Capital Employed (ROCE) of 12.8% in FY25, indicating its ability to generate attractive returns from shareholders’ equity and invested capital. Operational efficiency also remained strong, with an EBITDA margin of 21.3% and a PAT margin of 13.9%, supported by higher project execution, operational efficiencies, and increasing contributions from its renewable energy portfolio.
The company’s balance sheet remains robust, with a Debt-to-Equity ratio of just 0.14x, demonstrating a low dependence on borrowings despite significant business expansion. It also reported an Interest Coverage Ratio of 15.6x, indicating a strong ability to service debt obligations from operating earnings. Additionally, a Current Ratio of 7.7x highlights healthy liquidity, providing sufficient working capital to support ongoing projects and future investments. Overall, these financial ratios indicate that Sun Drops Energia is well-positioned to fund its growth while maintaining financial discipline.
Valuation
Based on FY25 financials, Sun Drops Energia was valued at a market capitalisation of approximately ₹2,559 crore, with the stock trading at a Price-to-Earnings (P/E) ratio of 49.9x, a Price-to-Book (P/B) ratio of 4.23x, and a Price-to-Sales (P/S) ratio of 6.93x. These valuation multiples are higher than those of traditional EPC companies, reflecting investor expectations of sustained earnings growth and the company’s strategic positioning within India’s renewable energy sector.
The premium valuation is supported by Sun Drops Energia’s integrated business model, strong financial performance, expanding renewable energy portfolio, and growing presence in the Battery Energy Storage System (BESS) segment. As the company prepares for its proposed FY27 IPO and executes large-scale energy storage projects, investors are assigning value not only to its current earnings but also to its long-term growth potential in India’s clean energy transition.
IPO Timeline
Sundrops Energia is preparing for its Initial Public Offering (IPO), with management confirming that the company aims to list during FY27. The management has also stated that it plans to file the Draft Red Herring Prospectus (DRHP) soon. The proposed IPO is expected to raise capital for expanding the company’s renewable energy and Battery Energy Storage System (BESS) business while supporting its long-term growth strategy.
Sun Drops Energia Share Price :Shareholding Pattern
Sundrops Energia is a subsidiary of KPI Green Energy Limited. Following a private placement in FY25, KPI Green’s stake reduced from 100% to around 83.38%, while retaining management control. After the proposed IPO, the parent company intends to maintain a majority stake of over 51%, ensuring Sundrops Energia continues to benefit from the KP Group’s operational expertise and strategic support.
Fundamentals
| Sun Drop Energie Share Price | 295 | Market Cap (in cr.) | ₹ 2258 CR |
| Unlisted Shares Price | Per Equity Share | Price to Earnings | 26 |
| Lot Size | P/S | 4.37 | |
| 52 Week High | 278 | P/B Ratio | 4.23 |
| 52 Week Low | 248 | Debt to Equity | 0.14 |
| Depository | CDSL & NSDL | ROE (%) | 16% |
| PAN Number | ABCCS1266N | Book Value | 69.72 |
| ISIN Number | INE0H1U01025 | Face Value | 5 |
| CIN | U40107GJ2019PTC108373 | Total Shares | 8.67 CR |
| RTA |
Financial
| P&L Statement | FY23 | FY24 | FY25 | FY26 |
|---|---|---|---|---|
| Revenue | 28.9 | 168.6 | 369 | 586 |
| Cost of Goods Sold | 15 | 117.2 | 266.1 | |
| Gross Profit | 13.8 | 50.9 | 100.6 | |
| Gross Margin (%) | 48 | 30.3 | 27.4 | |
| Total Pre-EBITDA Expenses | 18.1 | 129 | 290.5 | |
| EBITDA | 10.8 | 39.7 | 78.5 | |
| EBITDA Margin (%) | 37.3 | 23.5 | 21.3 | |
| Other Income | 0 | 0 | 0 | |
| Finance Cost | 2.4 | 2.6 | 4.6 | |
| Depreciation & Amortization | 1 | 1.9 | 4 | |
| EBIT | 9.7 | 37.2 | 72.3 | |
| EBIT Margin (%) | 33.8 | 22.1 | 19.7 | |
| PBT | 7.4 | 35.2 | 69.2 | 130 |
| PBT Margin (%) | 25.7 | 20.9 | 18.7 | 22 |
| Tax | 2.4 | 8 | 17.9 | |
| PAT | 5 | 27.2 | 51.3 | 97 |
| Net Profit Margin (%) | 17.4 | 16.1 | 13.9 | 17 |
Financial Ratios |
FY23 | FY24 | FY25 | FY26 |
|---|---|---|---|---|
| Operating Profit Margin (OPM %) | 37.3 | 23.5 | 21.3 | |
| EBIT Margin (%) | 33.8 | 22.1 | 19.7 | |
| Net Profit Margin (NPM %) | 17.4 | 16.1 | 13.9 | 17 |
| Earnings Per Share (EPS) (₹) | 0.58 | 3.13 | 5.91 | 11.98 |
| Assets | FY23 | FY24 | FY25 |
|---|---|---|---|
| Net Fixed Assets | 42.3 | 62.1 | 181.3 |
| Current Assets (Ex-Cash) | 20.9 | 111.4 | 259.3 |
| Trade Receivables | 7.1 | 65.6 | 122.6 |
| Inventory | — | — | — |
| Cash & Bank Balance | 3.6 | 32.7 | 102.8 |
| Other Assets | 2.8 | 1.2 | 194.7 |
| Total Assets | 69.5 | 207.5 | 738.1 |
| Liabilities | FY23 | FY24 | FY25 |
|---|---|---|---|
| Share Capital | 5.4 | 5.4 | 43.4 |
| Reserves & Surplus | 31.6 | 68.6 | 561.3 |
| Non-Current Liabilities | 21.4 | 30 | 86.5 |
| Current Liabilities | 11.1 | 103.6 | 47 |
| Trade Payables | 7 | 90.4 | 14.6 |
| Total Liabilities | 69.5 | 207.5 | 738.1 |
| Cash Flow Statement | FY23 | FY24 | FY25 |
|---|---|---|---|
| PBT | 7.4 | 35.2 | 69.2 |
| Adjustments | -3.5 | 0.1 | -211.3 |
| Cash Flow from Operations (Before Working Capital Changes) | 3.9 | 35.3 | -142.1 |
| Interest Paid | -2.4 | -2.6 | -4.6 |
| Income Tax Paid | 0.1 | 3.6 | 19.7 |
| Other Operating Cash Flows | — | -0.2 | 0.4 |
| Net Cash Flow from Operating Activities | 6.2 | 34.1 | -156.8 |
| Purchase of Long-Term Assets | -20.1 | -12.2 | -100.2 |
| Interest Received | 0.1 | 0.3 | 1.9 |
| Other Investing Cash Flows | -1.5 | -9.6 | -23 |
| Net Cash Flow from Investing Activities | -21.2 | -19.9 | -121.3 |
| Proceeds from Issue of Shares | — | — | 519.1 |
| Borrowings | 17.7 | 7.7 | -5.4 |
| Lease Liability Payments | — | -9.8 | -23.4 |
| Interest Paid (Financing) | 2.4 | 2.6 | 4.6 |
| Other Financing Cash Flows | — | — | -184.3 |
| Net Cash Flow from Financing Activities | 15.3 | 15 | 348.1 |
| Net Increase / (Decrease) in Cash | 0.3 | 29.2 | 70.1 |
| Cash & Bank Balance (Beginning) | 3.2 | 3.6 | 32.7 |
| Cash & Bank Balance (Ending) | 3.6 | 32.7 | 102.8 |
Promoters or Management
| Name | Designation | Experience | Linkedin Profile |
|---|---|---|---|
| Dr. Faruk G. Patel | Chairman | 32+ yrs |  |
| Mr. Sohil Dabhoya | Whole-Time Director | 15+ yrs | |
| Mr. Salim Suleman Yahoo | CFO | 27+ yrs | |